
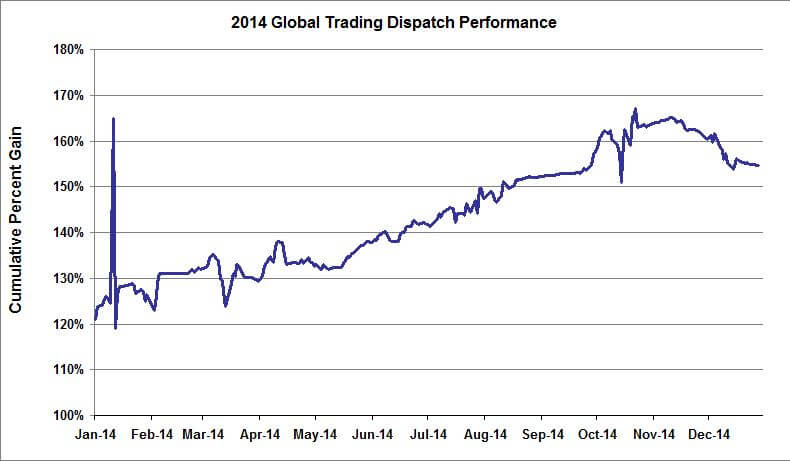
Global Trading Dispatch Performance
for the Year Ending 12/31/2014
| Since Inception*:? | 152.81% |
| Average Annualized Return:? | 37.42% |
| Trailing One Year Return: | 30.31% |
| Year End:? | 30.31% |
?
*Inception = 11/29/2010
More Global Trading Dispatch Results Below:
Click here for 2013 Global Trading Dispatch Results
Click here for 2012 Global Trading Dispatch Results
Click here for 2011 Global Trading Dispatch Results
The performance percentage is based on returns on capital using strict risk and money management rules given on each trade alert you receive.
Results are NON-Compounded. The quality of the Trades selected by John Thomas are responsible for the success of the service.
As an example, if you have US $100,000 portfolio allocated for Global Trading Dispatch Alerts and you use the money management?(how much of your US $100,000 should be allocated to the trade alert)?parameters given in the trade alert then:
If you executed a trade alert that produced a?2.75% profit?(as per the table below) then?your absolute dollar gain?based on your portfolio of US $100,000 would be:
100,000 x (2.75/100) = $2,750
Create a Free Account with The Mad Hedge Fund Trader?to receive Free Trade Alerts and Full Training to get you ready to create a steady income from your trading.
- Know how many contracts or shares you need to buy or sell based on your portfolio.
- Training on Risk and Money Management to avoid catastrophic losses.
- How to Execute the Trade Alerts.
- Trade Alert sent via Email.
- Updates on Each Open Trade Alert
Click Here to open your Free Account Now!
| ? | ? | ? | ? | Portfolio | ? | ? |
| ? | Date | Asset | ? | Net | ? | In Days |
| Symbol | Closed | Class | Long/Short | Exposure | Profit | Duration |
| ? | ? | ? | ? | ? | ? | ? |
| December 2014 | ? | ? | ? | ? | ? | ? |
| ? | ? | ? | ? | ? | ? | ? |
| (SCTY) 12/47.50-$52.50 call spread | 12/12/2014 | equities | long | 10.0% | -3.63% | 17 |
| (BAC) 12/$15-$16 call spread | 12/22/2014 | equities | long | 10.0% | 0.88% | 48 |
| ? | ? | ? | ? | ? | ? | ? |
| ? | ? | Total for the Month | ? | ? | -2.75% | ? |
| ? | ? | ? | ? | ? | ? | ? |
| November 2014 | ? | ? | ? | ? | ? | ? |
| ? | ? | ? | ? | ? | ? | ? |
| (BABA) 12/$100-$105 call spread | 11/19/2014 | equities | short | 10.0% | -2.38% | 5 |
| (BAC) 11/$15-$16 call spread | 11/21/2014 | equities | long | 10.0% | 2.04% | 50 |
| (SPY) 11/$179-$183 call spread | 11/21/2014 | equities | long | 10.0% | 1.44% | 30 |
| ? | ? | ? | ? | ? | ? | ? |
| ? | ? | Total for the Month | ? | ? | 1.10% | ? |
| ? | ? | ? | ? | ? | ? | ? |
| October 2014 | ? | ? | ? | ? | ? | ? |
| ? | ? | ? | ? | ? | ? | ? |
| (FXE) 11/$128-$130 put spread | 10/3/2014 | foreign exchange | long | 10.0% | 1.86% | 8 |
| (SPY) 11/$185-$190 call spread | 10/13/2014 | equities | long | 10.0% | -1.51% | 13 |
| (TSLA) 11/$200 call spread | 10/13/2014 | equities | long | 10.0% | -1.62% | 19 |
| (SPY) 10/$180-$184 call spread | 10/15/2014 | equities | short | 10.0% | -2.13% | 1 |
| (IWM) 11/$117-$120 put spread | 10/16/2014 | equities | long | 10.0% | 2.26% | 27 |
| (IWM) 11/$116-$119 put spread | 10/16/2014 | equities | long | 10.0% | 2.21% | 20 |
| (SPY) 10/$202-$205 Put spread | 10/17/2014 | equities | long | 10.0% | 1.22% | 21 |
| (SPY) 10/$202-$205 Put spread | 10/17/2014 | equities | long | 10.0% | 1.29% | 18 |
| (GILD) 11/$80-$85 call spread | 10/20/2014 | equities | long | 10.0% | 2.57% | 4 |
| (DAL) 11/$25-$27 call spread | 10/20/2014 | equities | long | 10.0% | 1.89% | 5 |
| (TLT) 11/$122-$125 put spread | 10/20/2014 | fixed income | long | 10.0% | -1.55% | 11 |
| (AAPL) 11/$87.50-$92.50 call spread | 10/21/2014 | equities | long | 10.0% | 1.56% | 4 |
| (SPY) 11/$168-$173 call spread | 10/21/2014 | equities | long | 10.0% | 1.51% | 6 |
| (FXE) 11/$128-$130 put spread | 10/29/2014 | foreign exchange | long | 10.0% | 1.48% | 20 |
| (SPY) 11/$197-$202 call spread | 10/29/2014 | equities | short | 10.0% | -4.22% | 9 |
| (FXE) 11/$127-$129 put spread | 10/29/2014 | foreign exchange | long | 10.0% | 2.22% | 22 |
| (FXY) 11/$92-$95 puts spread | 10/30/2014 | foreign exchange | long | 10.0% | 0.86% | 7 |
| (TBT) short Treasury Bond ETF | 10/31/2014 | fixed income | long | 10.0% | 0.22% | 17 |
| ? | ? | ? | ? | ? | ? | ? |
| ? | ? | Total for the Month | ? | ? | 10.12% | ? |
| ? | ? | ? | ? | ? | ? | ? |
| September 2014 | ? | ? | ? | ? | ? | ? |
| ? | ? | ? | ? | ? | ? | ? |
| (TBT) short Treasury Bond ETF | 9/12/2014 | fixed income | long | 10.0% | 0.08% | 57 |
| (FXE) 10/$128-$130 put spread | 9/30/2014 | foreign exchange | long | 10.0% | 1.45% | 11 |
| ? | ? | ? | ? | ? | ? | ? |
| ? | ? | Total for the Month | ? | ? | 1.53% | ? |
| ? | ? | ? | ? | ? | ? | ? |
| August 2014 | ? | ? | ? | ? | ? | ? |
| (FXE) 8/$134-$136 put spread | 8/5/2014 | foreign exchange | long | 10.0% | 0.99% | 23 |
| (SPY) 8/$202.50 -205 put spread | 8/6/2014 | equity | long | 10.0% | 0.88% | 14 |
| (SPY) 8/$202.50 - $202.50 put spread | 8/6/2014 | equity | long | 10.0% | 2.75% | 15 |
| (TLT) 8/$115-$118 put spread | 8/13/2014 | fixed income | long | 10.0% | -0.18% | 7 |
| (TLT) 8/$117-$120 put spread | 8/15/2014 | fixed income | long | 10.0% | 0.81% | 23 |
| (FXE) 9/$133-$135 put spread | 8/25/2014 | foreign exchange | long | 10.0% | 2.07% | 18 |
| (FXE) 9/$133-$135 put spread | 8/26/2014 | foreign exchange | long | 10.0% | 0.94% | 8 |
| ? | ? | ? | ? | ? | ? | ? |
| ? | ? | Total for the Month | ? | ? | 8.26% | ? |
| ? | ? | ? | ? | ? | ? | ? |
| July 2014 | ? | ? | ? | ? | ? | ? |
| (CAT) 7/$97.50-$100 call spread | 7/3/2014 | equity | long | 10.0% | 1.04% | 27 |
| (MSFT) 7/$38-$40 call spread | 7/18/2014 | equity | long | 10.0% | 0.87% | 28 |
| (SPY) 7/$202 put spread | 7/18/2014 | equity | long | 10.0% | 1.37% | 20 |
| (FXE) 8/$138 put spread | 7/23/2014 | foreign exchange | long | 10.0% | 1.51% | 17 |
| (AAPL) 8/$85-$90 call spread | 7/24/2014 | equity | long | 10.0% | 2.30% | 4 |
| (GM) 8/$33-$35 call spread | 7/30/2014 | equity | long | 10.0% | -2.91% | 11 |
| ? | ? | ? | ? | ? | ? | ? |
| ? | ? | Total for the Month | ? | ? | 4.18% | ? |
| ? | ? | ? | ? | ? | ? | ? |
| June 2014 | ? | ? | ? | ? | ? | ? |
| (TLT) 7/$118-$121 put spread | 6/4/2014 | fixed income | long | 10.0% | 1.44% | 36 |
| (AAPL) 7/$540 $570 call spread | 6/4/2014 | equity | long | 10.0% | 1.22% | 41 |
| (FXY) 7/$98-$101 put spread | 6/6/2014 | foreign exchange | long | 10.0% | 1.14% | 36 |
| (IBM) 7/$180-$185 call spread | 6/11/2014 | equity | long | 10.0% | -1.27% | 29 |
| (GOOGL) 7/$480-$520 call spread | 6/17/2014 | equity | long | 10.0% | 1.16% | 21 |
| (JPM) 7/$52.50-$55.00 call spread | 6/23/2014 | equity | long | 10.0% | 1.81% | 66 |
| ? | ? | ? | ? | ? | ? | ? |
| ? | ? | Total for the Month | ? | ? | 5.50% | ? |
| ? | ? | ? | ? | ? | ? | ? |
| May 2014 | ? | ? | ? | ? | ? | ? |
| (TLT) 5/$113-$116 put spread | 5/2/2014 | fixed income | long | 30.0% | -0.87% | 37 |
| (SPY) 6/$193-$196 put spread | 5/6/2014 | equity | long | 10.0% | 0.88% | 12 |
| (VXX) long volatility ETN | 5/12/2014 | volatility | long | 30.0% | -0.81% | 40 |
| (VXX) long volatility ETN | 5/12/2014 | volatility | long | 30.0% | -0.87% | 27 |
| (TLT) 7/$116-$119 put spread | 5/27/2014 | fixed income | long | 10.0% | 2.48% | 32 |
| ? | ? | ? | ? | ? | ? | ? |
| ? | ? | Total for the Month | ? | ? | 0.81% | ? |
| ? | ? | ? | ? | ? | ? | ? |
| April 2014 | ? | ? | ? | ? | ? | ? |
| (SPY) 5/$193-$196 put spread | 4/7/2014 | equity | long | 10.0% | 1.81% | 7 |
| (IWM) 8/$113 puts | 4/8/2014 | equity | long | 10.0% | 2.38% | 8 |
| (FXY) 5/$96-$99 put spread | 4/8/2014 | foreign currency | long | 10.0% | 0.60% | 4 |
| (VXX) long volatility ETN | 4/11/2014 | equity | long | 10.0% | 0.06% | 7 |
| (VXX) long volatility ETN | 4/11/2014 | equity | long | 10.0% | 0.20% | 4 |
| (VXX) long volatility ETN | 4/11/2014 | equity | long | 10.0% | 0.76% | 10 |
| (SPY) 5/$191-$194 put spread | 4/11/2014 | equity | long | 10.0% | 2.02% | 17 |
| (SPY) 5/$188-$191 put spread | 4/21/2014 | equity | long | 30.0% | -6.63% | 15 |
| (TLT) 5/$114-$117 put spread | 4/28/2014 | fixed income | long | 30.0% | 2.10% | 11 |
| (SPY) 5/$189-$192 put spread | 4/29/2014 | equity | long | 30.0% | -0.45% | 5 |
| (SPY) 5/$192-$195 put spread | 4/30/2014 | equity | long | 30.0% | 1.05% | 9 |
| ? | ? | ? | ? | ? | ? | ? |
| ? | ? | Total for the Month | ? | ? | 3.90% | ? |
| ? | ? | ? | ? | ? | ? | ? |
| March 2014 | ? | ? | ? | ? | ? | ? |
| (BAC) 3/$15-$16 call spread | 3/6/2014 | equity | long | 10.0% | 1.39% | 8 |
| (SPY) 3/$189-$192 put spread | 3/6/2014 | equity | long | 10.0% | -1.67% | 19 |
| (TLT) 3/$111-$114 put spread | 3/7/2014 | bonds | long | 10.0% | 1.07% | 21 |
| (GM) 4/$34-$36 call spread | 3/11/2014 | equity | long | 10.0% | -2.96% | 27 |
| (DAL) 4/$30-$32 Call spread | 3/17/2014 | equity | long | 10.0% | 0.76% | 16 |
| (EBAY) 4/$52.50- $55 call spread | 3/18/2014 | equity | long | 10.0% | 0.24% | 15 |
| (TLT) 4/$111-$114 put spread | 3/18/2014 | fixed income | long | 10.0% | 1.68% | 11 |
| (BAC) 4/$16 calls | 3/20/2014 | equity | long | 10.0% | -2.01% | 49 |
| (GE) 4/$24-$25 call spread | 3/24/2014 | equity | long | 10.0% | -0.73% | 45 |
| ? | ? | ? | ? | ? | ? | ? |
| ? | ? | Total for the Month | ? | ? | -2.23% | ? |
| ? | ? | ? | ? | ? | ? | ? |
| February 2014 | ? | ? | ? | ? | ? | ? |
| (AAPL) 2/$460-$490 call spread | 2/5/2014 | equity | long | 10.0% | 1.06% | 19 |
| (TLT) 2/$108-$111 put spread | 2/6/2014 | equity | long | 10.0% | 0.47% | 50 |
| (TLT) 6/$106 puts | 2/6/2014 | equity | long | 10.0% | 2.27% | 8 |
| (UNG) 7/$23 puts | 2/6/2014 | equity | long | 5.0% | 0.66% | 55 |
| (UNG) 7/$26 puts | 2/26/2014 | energy | long | 5.0% | 1.40% | 8 |
| ? | ? | ? | ? | ? | ? | ? |
| ? | ? | Total for the Month | ? | ? | 5.86% | ? |
| ? | ? | ? | ? | ? | ? | ? |
| January 2014 | ? | ? | ? | ? | ? | ? |
| (XLF) 1/$19-$21 call spread | 1/10/2014 | equity | long | 10.0% | 1.45% | 10 |
| (SPY) 1/$173-$176 call spread | 1/13/2014 | equity | long | 10.0% | 1.18% | 7 |
| (XLK) 1/$33-$35 call spread | 1/14/2014 | equity | long | 10.0% | 3.40% | 4 |
| (GILD) 1/$67.50-$70 call spread | 1/14/2014 | equity | long | 10.0% | 1.55% | 4 |
| (XLE) 1/$83-$86 call spread | 1/14/2014 | equity | long | 10.0% | 0.43% | 12 |
| (FXY) 1/$95-$98 put spread | 1/15/2014 | foreign exchange | long | 10.0% | 1.52% | 12 |
| (TLT) 1/$104-$107 put spread | 1/15/2014 | fixed income | long | 10.0% | 0.15% | 4 |
| (AAPL) 1/$490-$520 call spread | 1/16/2014 | equity | long | 10.0% | 2.18% | 14 |
| (T) 2/$35-$37 put spread | 1/23/2014 | equity | long | 10.0% | 1.08% | 19 |
| Softbank shares (SFTBY) | 1/19/2014 | equity | long | 10.0% | -2.86% | 3 |
| ? | ? | ? | ? | ? | ? | ? |
| ? | ? | Total for the Month | ? | ? | 10.08% | ? |